Please note that what is described here is based on Shannon & Boersma (2018) and some implementation details will have changed since then.
2 Design
PyPAHdb analyzes spectroscopic observations (including spectral maps) and characterizes the PAH emission in terms of PAH ionization and size fractions using a database-fitting approach.
The pyPAHdb package is imported with the following statement:
import pypahdb
2.1 Flowchart
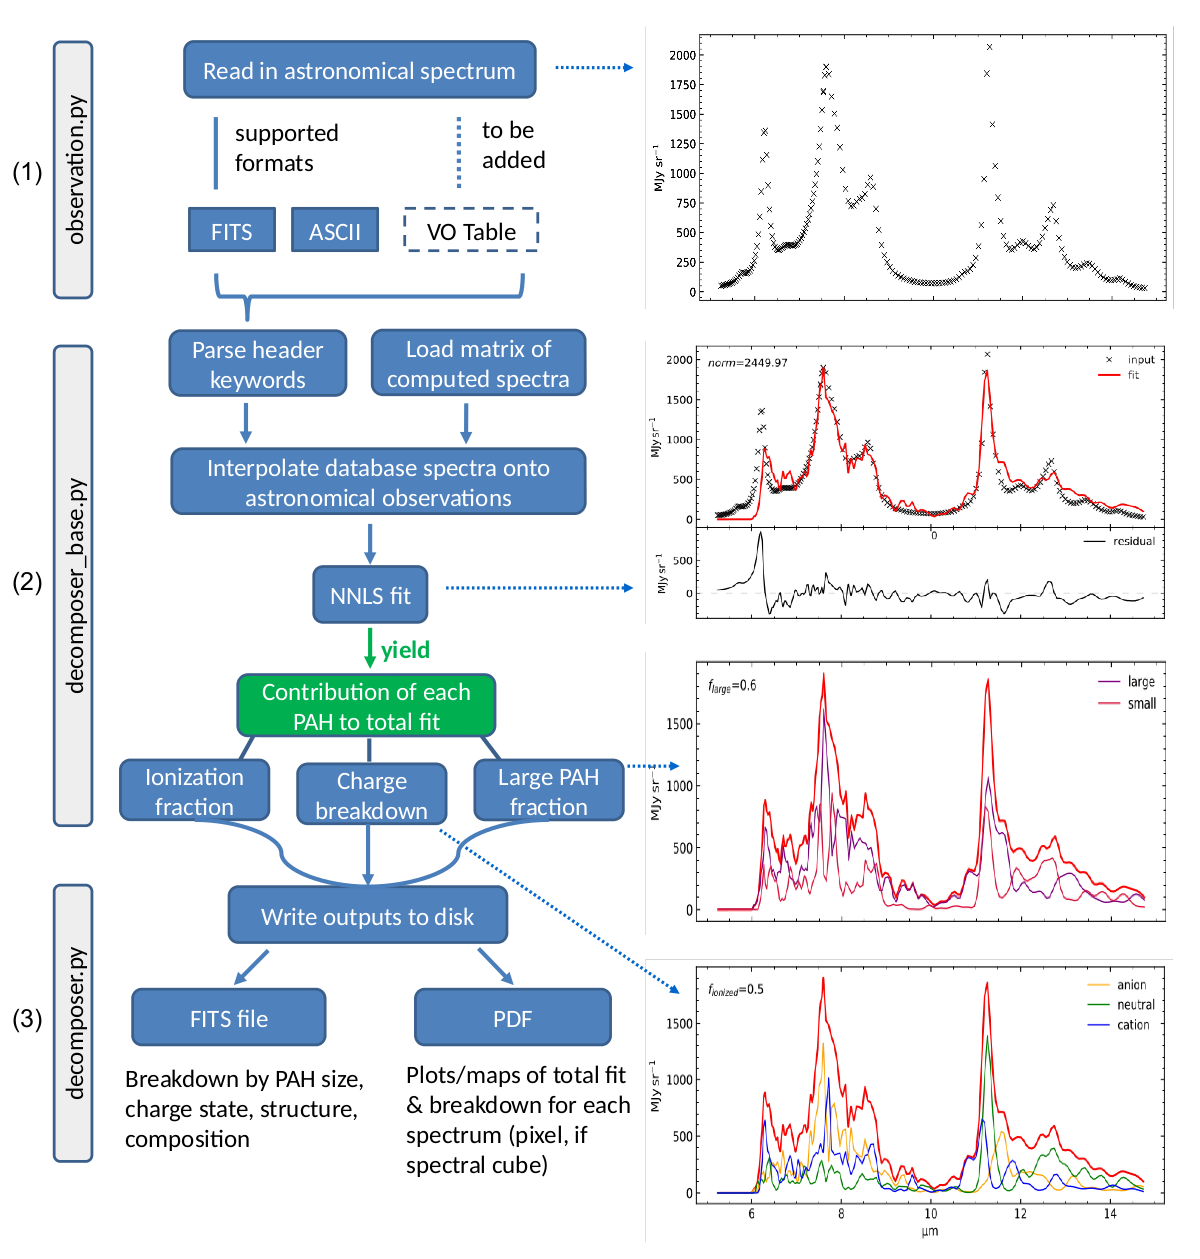
PyPAHdb flowchart. (1) Astronomical spectroscopic data is loaded from FITS or ASCII files. (2) A highly over-sampled pre-computed matrix of PAH spectra is loaded and interpolated onto the wavelength grid of the astronomical observations. Database-fitting is performed using a non-negative least-squares (NNLS) approach, which yields the contribution of an individual PAH molecule. As a result, the fit can be broken down in terms of PAH charge and size. (3) The results are written to disk as a single FITS file and as a PDF summarizing the results (one page per pixel, if a spectral cube is provided as input).
The general program methodology is encapsulated in the flowchart presented in the figure above and is as follows:
Read-in a file containing spectroscopic PAH observations of an astronomical object. This functionality is provided by the class
Observation, which is implemented inobservation.py. It is the responsibility of the user to ensure all non-PAH emission components have been removed from the spectrum. The class uses a fall-through try-except chain to attempt to read the given filename using the facilities provided byastropy.io. The spectroscopic data is stored as aspecutils.Spectrum1Dobject. TheSpectrum1Dclass provides functionality to convert between different coordinate representations. Below is example Python code demonstrating the use of the class. The filesample_data_NGC7023.tblin this demonstration is bundled with the pyPAHdb package. The output of the demonstration code is shown in the flowchart.
import pkg_resources

import matplotlib.pyplot as plt
from pypahdb.observation import Observation

file_path = 'resources/sample_data_NGC7023.tbl'
data_file = pkg_resources.resource_filename('pypahdb', file_path)

obs = Observation(data_file)
s = obs.spectrum
plt.plot(s.spectral_axis, s.flux[0,0,:])
plt.show()
Decompose the observed PAH emission in terms of contributing PAH subclasses, here charge and size. This functionality is provided by the class
Decomposer, which is implemented indecomposer.pyand takesdecomposer_base.pyas its base. TheDecomposerclass takes as input aSpectrum1Dobject, of which it takes a deep copy and calls theUnit.tomethod on to convert the abscissa units to wavenumber. Subsequently, a pre-computednumpymatrix of highly oversampled PAH emission spectra stored as apickleis loaded from file. Utilizingnumpy.interp, each of the PAH emission spectra, represented by a single column in the pre-computed matrix, is interpolated onto the frequency grid (in wavenumber) of the input spectrum. This process is parallelized using themultiprocessingpackage.optimize.nnlsis used to perform a non-negative least-squares (NNLS) fit of the interpolated, pre-computed spectra to the input spectra. NNLS is chosen because it is appropriate to the problem, fast, and always converges. The solution vector (weights) is stored as an attribute and considered private toDecomposer. Combining lazy instantiation and Python’s @property, the fit and the breakdown can be retrieved. When the input spectrum represents a spectral cube the calculations are parallelized across each pixel using, again, themultiprocessingpackage. Below is example code demonstrating the use of theDecomposerand extends the previous code-block. The output from the code-block is shown in the flowchart.
from pypahdb.decomposer import Decomposer

result = Decomposer(obs.spectrum)
s = result.spectrum
plt.plot(s.spectral_axis, s.flux[0,0,:], 'x')
plt.plot(s.spectral_axis, result.fit[:,0,0])
plt.show()
Save the results to file. The output summarizes the results from the
Decomposerclass to allow users assessing the quality of the fit and store the derived PAH properties for later retrieval. TheDecomposerclass usesastropy.fitsto write FITS-files. The class will attempt to incorporate relevant information when a (FITS) header is provided. Below is example code demonstrating the use of the class, which extends the previous code-block. The output from the code-block is shown in the flowchart.
result.save_pdf('NGC7023_pypahdb.pdf')
result.save_fits('NGC7023_pypahdb.fits', header=obs.header)
2.2 Supported data formats
PyPAHdb supports reading in IPAC tables, Spitzer FITS files, and JWST FITS files. Support for reading pahfit[1]-files is underway. Pahfit is being developed as part of the same JWST ERS Program[2] as pyPAHdb.